
Polygon (MATIC) Price Prediction and Analysis: 2022-2025 - Can MATIC
The Global Inflation Drops Bitcoin’s Value: August 20

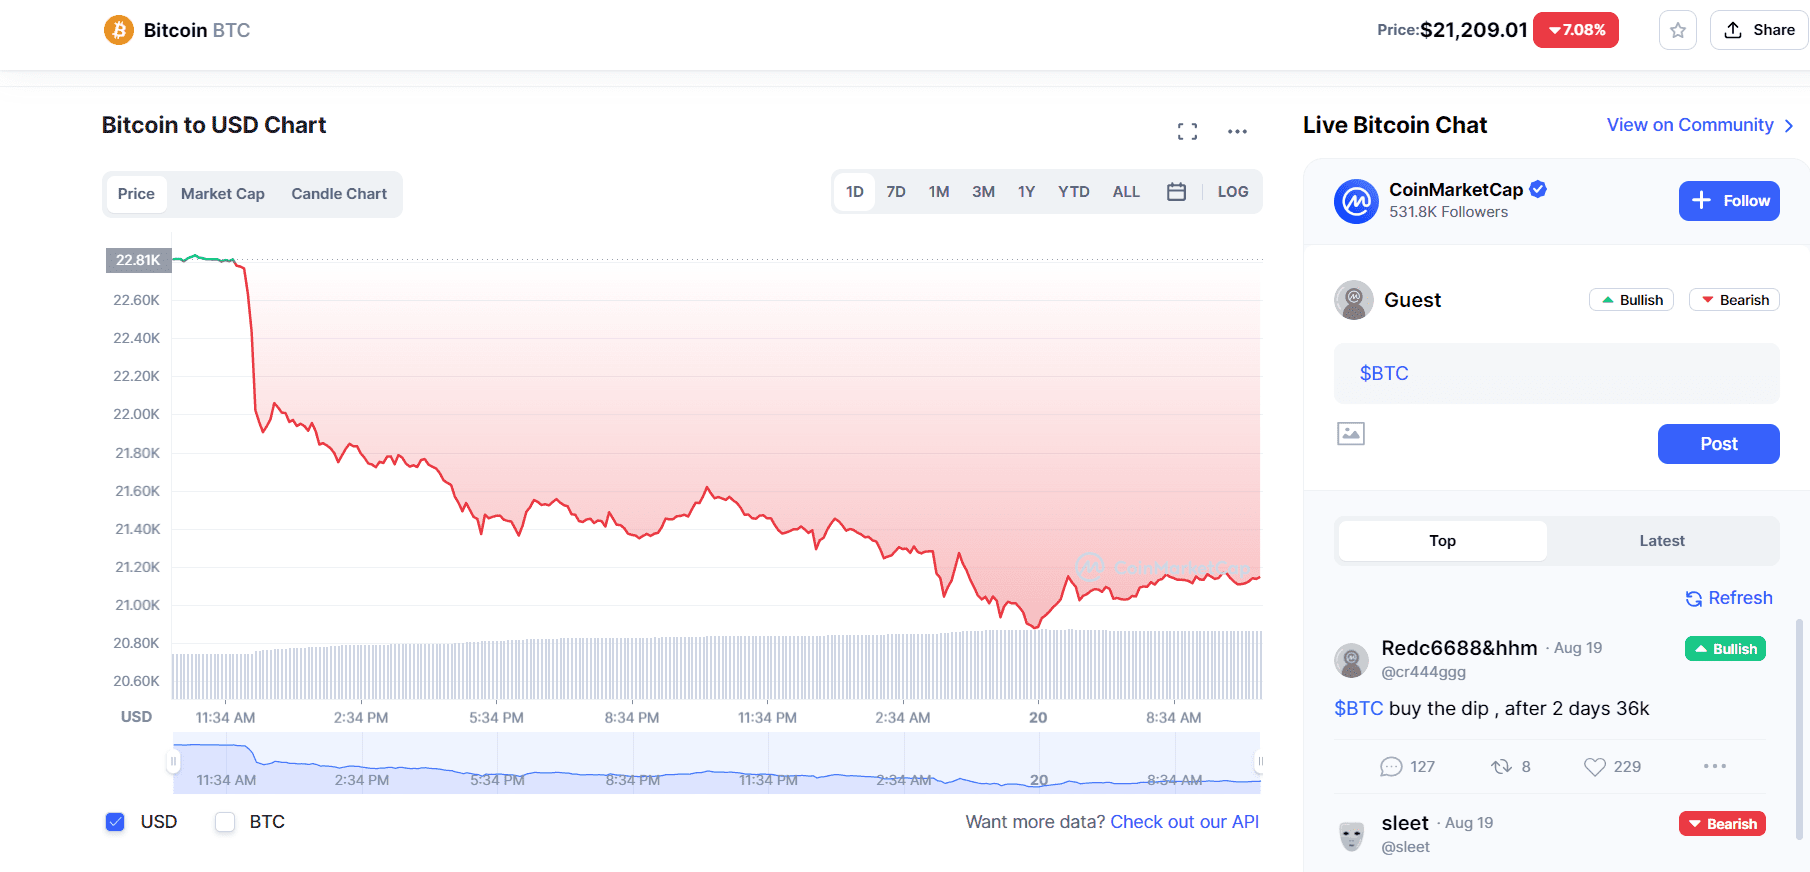
Over the past 24 hours, Bitcoin has lost more than 8% of its value after a dramatic selloff on Friday’s trade. It is currently trading below $21,300. According to market capitalization, the biggest cryptocurrency has had a weekly decline of 13%. As unusually high inflation figures came out of Germany, the drop began during overnight trading. In contrast to predictions of 32%, annual producer inflation in Germany reached a new high of 37% in July. Manufacturers’ selling prices are reflected in producer pricing for a certain area. Similarly to U.S. PPI data, German PPI data is comparable. Comparatively speaking, the PPI reading for the United States in July was 9.8%.
What we are going to learn?
A Drop in price
The German PPI announcement’s timing in relation to the decline in BTC prices is shown in the hourly BTC chart below. In comparison to the 20-hour moving average for BTC, the decrease coincided with an abnormally high volume around 06:00 UTC. Additionally, a price band with typically smaller quantities was where the reduction took place. A group of low volume nodes with a price range of $22,000–$21,000 are visible when the Volume Profile Visible Range function is used on the hourly chart for BTC.
The German PPI Data
Bitcoin saw a large overnight decline as a result of Germany’s unexpectedly negative inflation data. Around the time of the publication of the German PPI data, the hourly chart for BTC shows a 4% fall. The research increases market concerns that the U.S. Federal Reserve and some other national banks may adopt drastic measures to combat inflation, which would probably have a detrimental effect on asset values.
BTC’s 4 hour chart’s Relative Strength Index fell to oversold levels

Following the price decrease, BTC’s 4 hourly chart’s Relative Strength Index fell to oversold levels. A popular technical indicator that assesses price momentum is the RSI. A rating of 70 or higher indicates that an asset is overbought, whereas a level of 30 or lower indicates that an asset is oversold. As you can see in the chart above the last 4 hours RSI for BTC is 28.19(in the yellow line).
The density of put options near $21,000, which have risen to 3,300 BTC, in light of today’s fall. With a put option, you have the choice but not the commitment to trade an asset for a certain price. In the event that BTC prices fall under $21,000, investors holding puts at that price will be motivated to utilize their ability to sell BTC, further putting downward pressure on BTC.