If you are an experienced trader of Bitcoin or you have been following Bitcoin news, you would realise the Bitcoin operates in market cycles. There have been four market cycles till date. The first cycle was in 2011, second one in 2013, third in 2017 and currently we are in the fourth market cycle (2020-21).
Since the past couple of weeks, Bitcoin has been correcting from the all time high of $64,800 on April 14, 2021. This has led to many speculate if the Bitcoin bull market cycle is over and whether we are entering into a bear market. Some other people have also started comparing the 2013 market cycle with the current one. So, in this article we try and compare the two market cycles and evaluate whether we have reached our market cycle top or not and what the future holds for us.
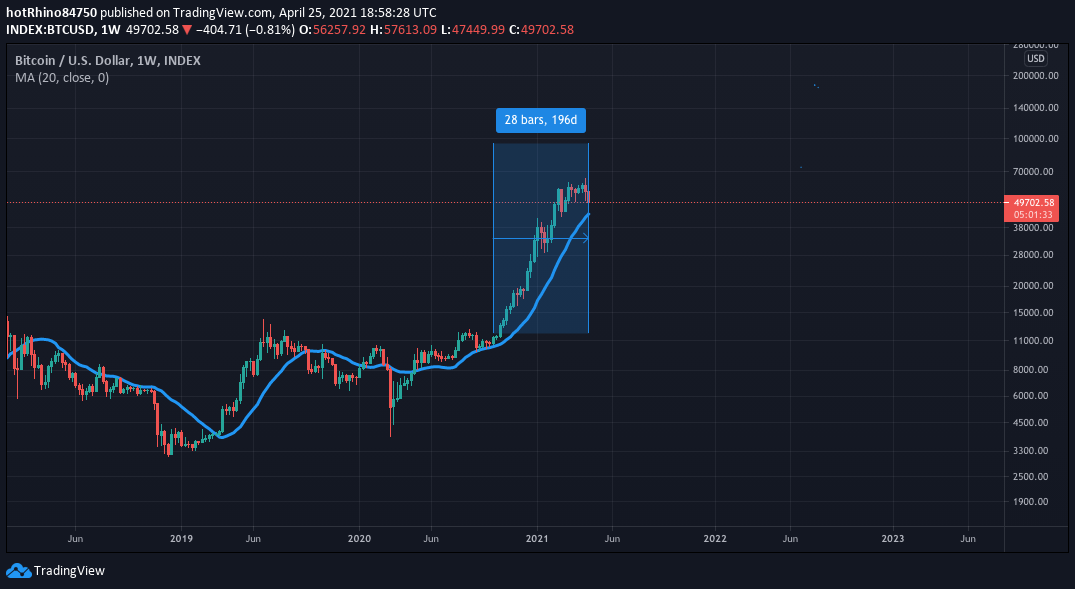
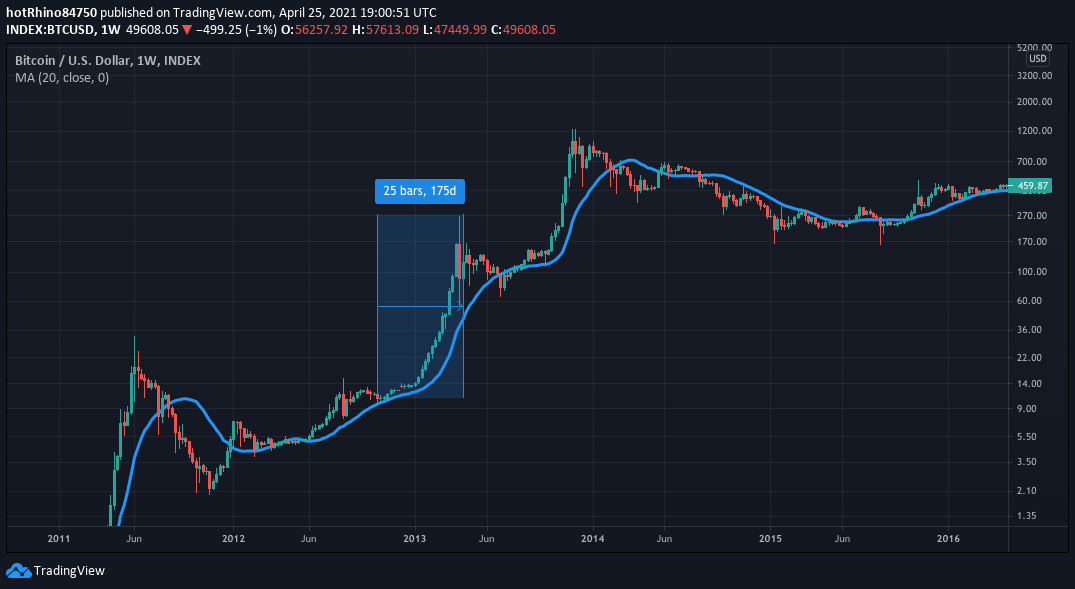
Testing of the 20 Week Simple Moving Average
In the current market cycle, we last tested the 20 week simple moving average back on the week of October 5, 2020. So, its been around 196 days that we have tested the 20 week simple moving average.
Now, let’s jump onto the 2013 chart and see if we can find any similarities. In 2013, we can see that we left the 20 Week simple moving average on 22nd October, 2012 and then tested it back on 15th April, 2013. So, a gap of 175 days between the two tests of the 20 Week Simple Moving Average.
Correction After Local Top
In 2013, Bitcoin made a local high of $270 in the week of April 15, 2013. From this top, Bitcoin corrected by almost 76% to touch a low of $65.
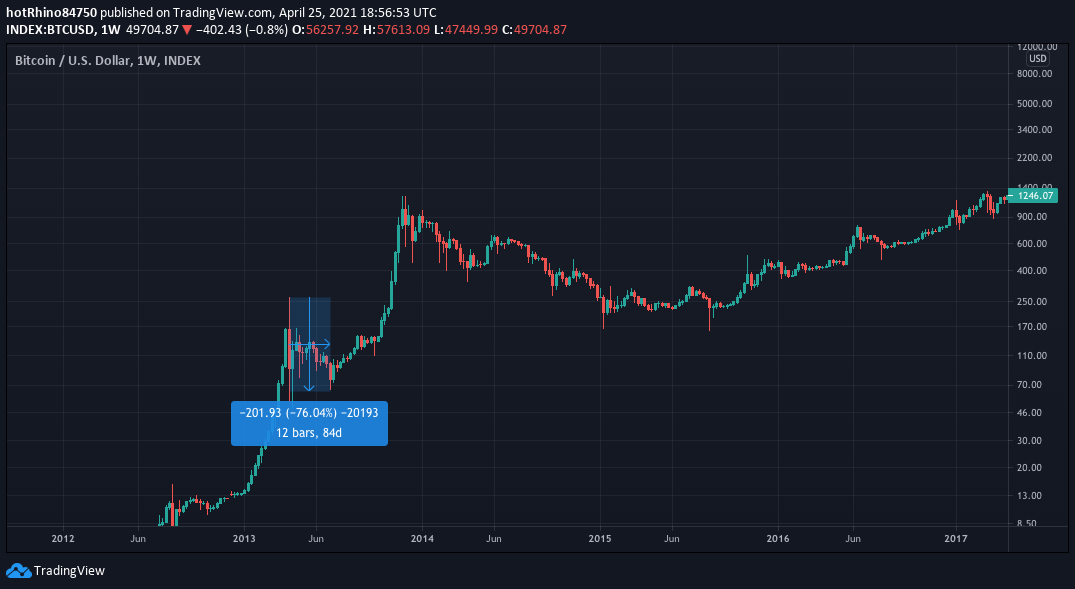
In 2021, if BItcoin corrects from its high of $65,800, by 76%, we’ll reach at around $15,800. This seems highly improbable given that the market has matured to a certain degree and also the volatility has declined.
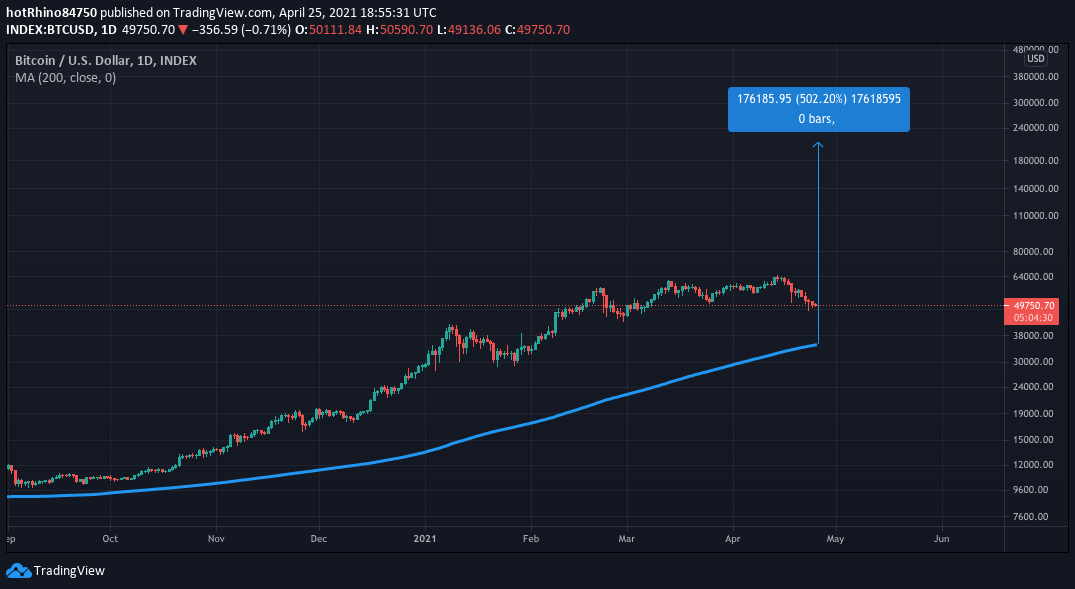
Now, the question arises what is the maximum extent to which Bitcoin may correct in 2021? According to me, the bottom level that Bitcoin may touch is close to the 200 Day Moving Average which is currently at $34,950.
Rise from Temporary Dip
After correcting to $65 in July 2013, Bitcoin started heading north again and clicked a high of $1243 in November,2013. This was a gain of almost 1800% from the bottom of $65.
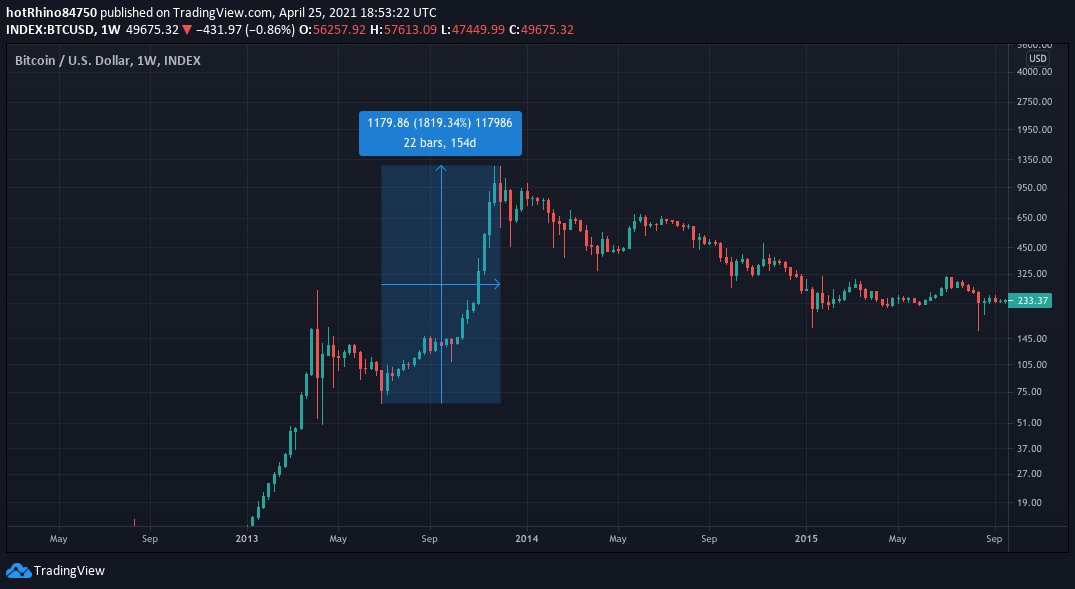
If Bitcoin is to follow a similar path in 2021 and as stated earlier that it may correct upto $34,950, a 1800% gain would put BItcoin at a value of more than $600,000. This seems highly improbable given the maturity in the market and also the diminishing rate of returns for Bitcoin (described later in the article). So, what could be a realistic gain from the bottom? According to me a gain of around 500% looks to be on the cards. This will make Bitcoin reach $210,000.
Similarity in the Relative Strength Index (RSI)
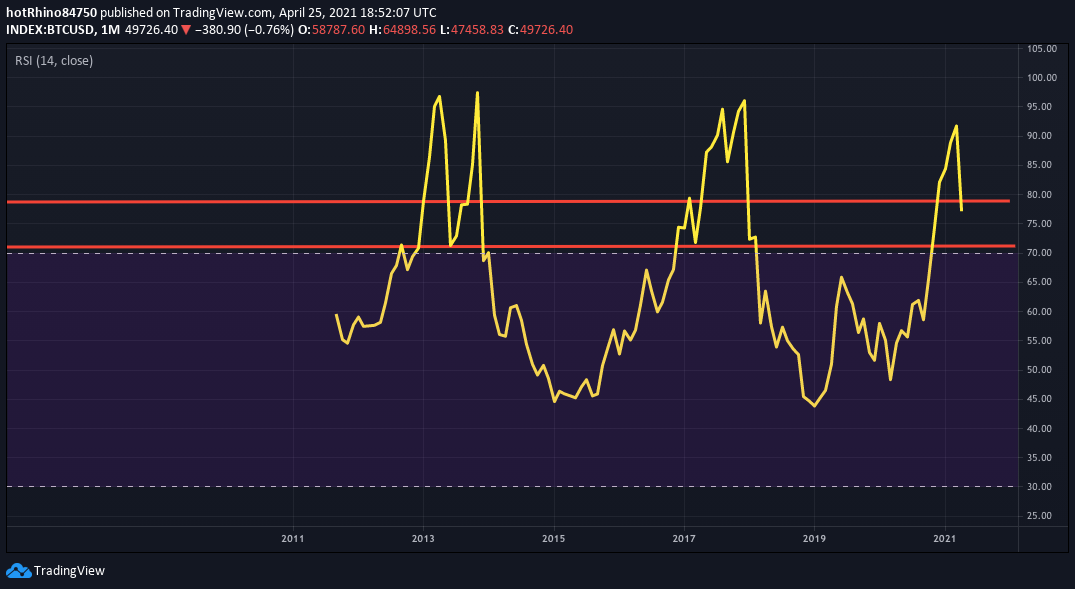
If we go to the monthly chart of Bitcoin and plot the RSI, we notice a similar pattern across market cycles. The pattern being that the RSI tends to peak twice in the range of 95-97.
In 2013, the RSI clicked 96.94 and 97.71 in two respective peaks. In 2017, the RSI clicked 94.95 and 96.33 in the two peaks and in the single that we have seen so far in this cycle, the RSI has clicked 92 level and is currently on a downward facing slope.
When correcting a major level of support for the RSI is at 71 level and minor support is at around the 78-79 level. But, the current RSI has already broken below this level and currently is at 77 level.
Diminishing Rate of Returns
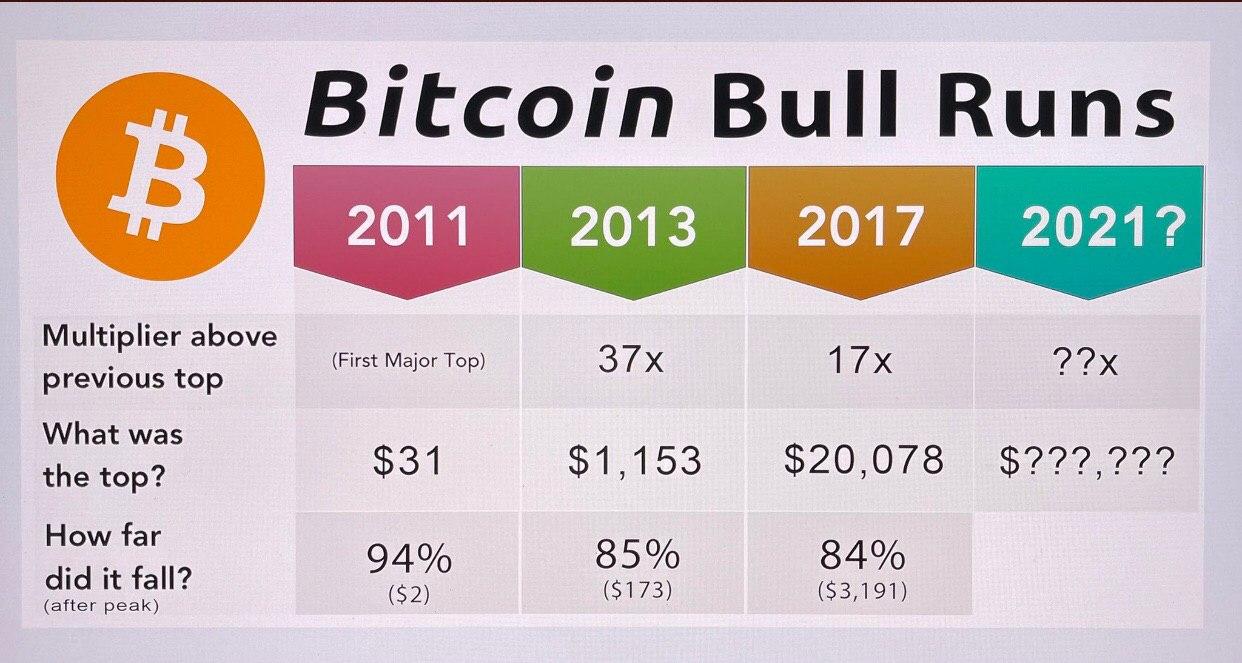
While analysing the previous market cycles of Bitcoin and we realise that Bitcoin follows a diminishing rate of returns. Now, what does this mean? This means that the return that BItcoin provides to the investors is actually declining by each market cycle. For example, investors got 37x returns in 2013 from the previous lows and in 2017 investors got 17x returns.
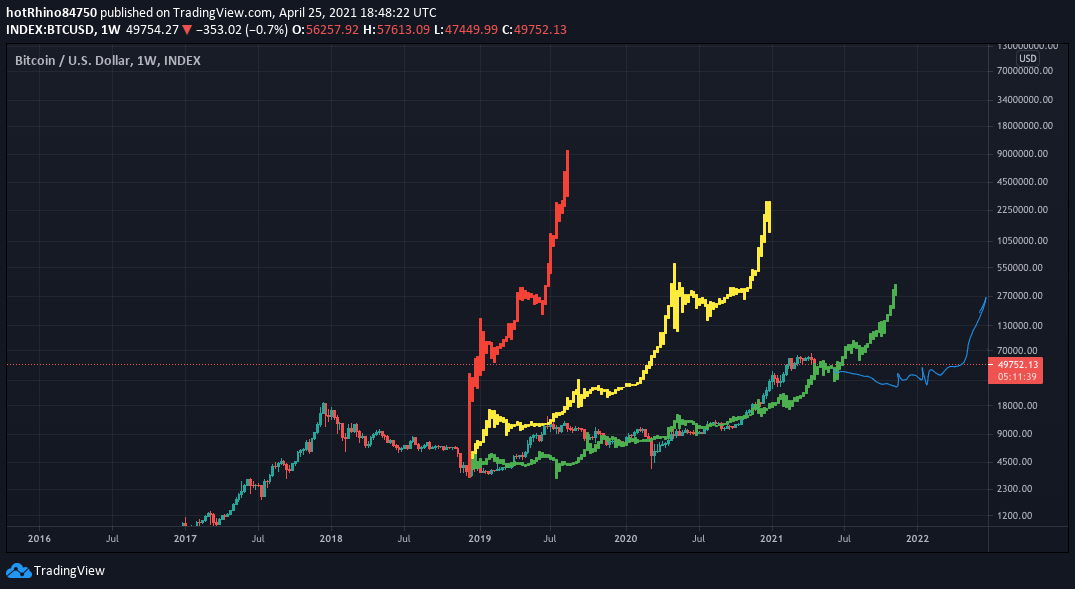
Now, it’s not only the returns that are lower, but also the time taken for giving these returns are also higher. In the below image, the red pattern is a reflection of the 2011 market cycle, the yellow being the 2013 and the green one being the 2017. One thing which we should notice at this point of time is that the current rate of return of Bitcoin is actually higher than the 2017 rate, which is quite unusual for Bitcoin.
I believe that given the above scenario, we’ll either move sideways or correct to a certain extent till the time our rate of return for this cycle is lower than the previous one.
Video: 2013 vs 2021 - A Comparison of the Bitcoin Market Cycles
Final Thoughts: What’s going to happen next in 2021?
I believe the correction that BItcoin is going through currently is very healthy for the long term perspective. This may serve as a launching pad for the next parabolic move. The levels to watch out for is the 100 Day Simple Moving Average which is currently acting as a support. If we break below this level the next level to watch out for will be the Bull Market Support Band (the zone between the 20 Week Simple Moving Average and the 21 Week Exponential Moving Average). If we break below this level then our final target will be the 200 Day Moving Average.


